


Opening the Locations page will show you a list of your locations.
There are various ways to view the locations on this page – read more about this.
Click on the Location you wish to view.
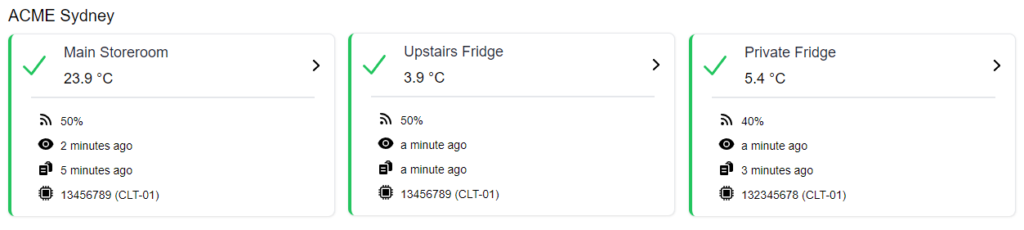

By default, you will open in the Graph view.
To change to table view, choose Table from the options menu.

There are three main view options:

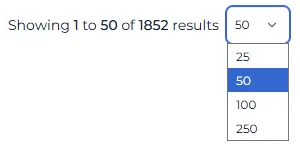
A the bottom of the table, you can change the number of results displayed
This will show you a daily summary of temperatures.
As before, if any day has out of range temperatures, these will be highlighted.
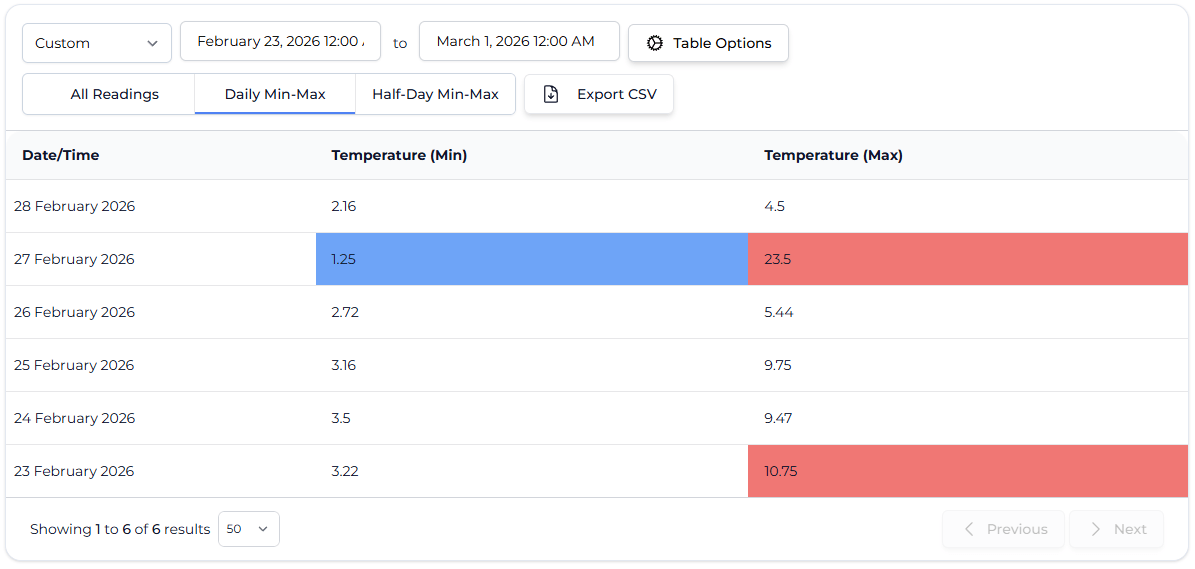
If you need to report morning and afternoon temperatures, you will find this table very useful.
It shows a summary of morning (midnight to noon) and afternoon (noon to midnight)
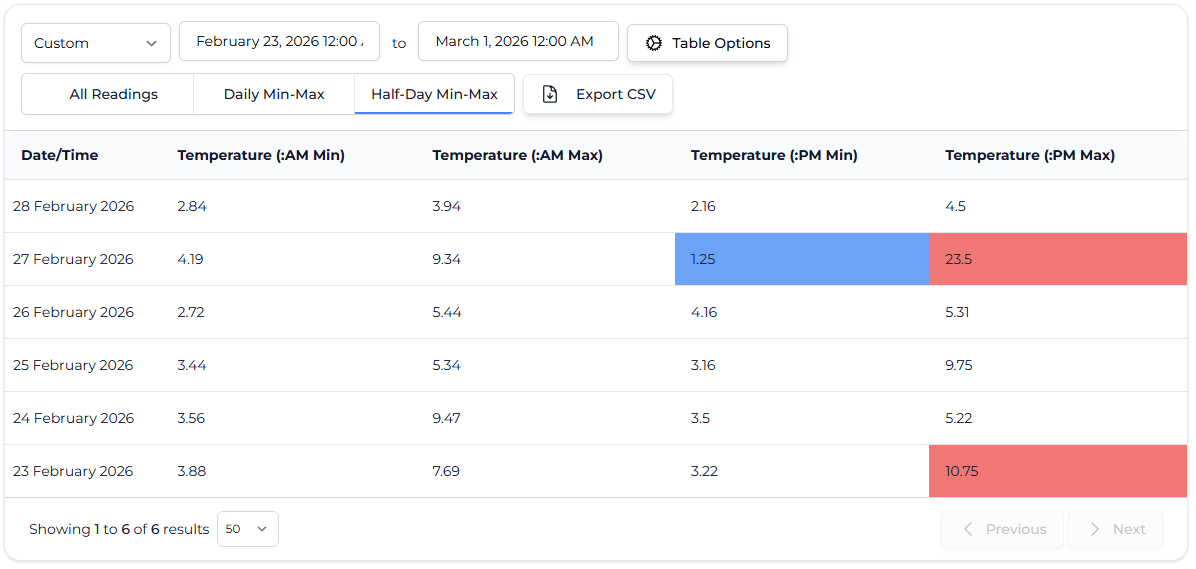
Above the table, there are a number of filters that allow you to select just the data you need.
The quick and easy way to select recent data is to use a preset.
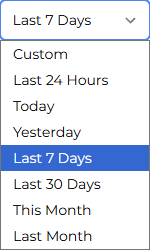
To get exactly the data you want, the Date/Time Picker lets you zoom in to any date range.


The National Association of Testing Authorities (NATA) is the recognised national accreditation authority for analytical laboratories and testing service providers in Australia. It is an independent, not-for-profit organisation that provides independent assurance of technical competence.
NATA accredits organisations to perform testing and inspection activities for their products and services. This gives consumers the assurance they need to make safe, healthy and reliable choices .
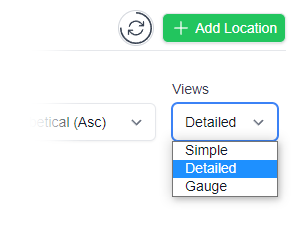
In the top right corner of the Location page, you will find the View chooser.
There are three options: Simple, Detailed and Gauge.

Simple View
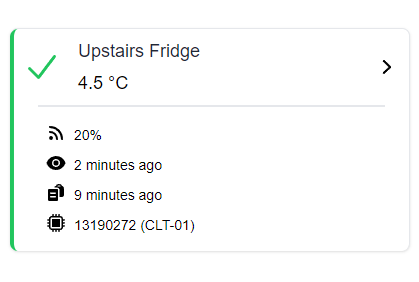
Detailed View
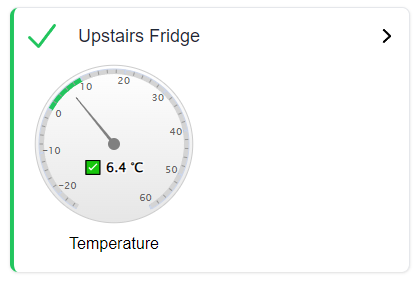
Gauge View
| QUICK SPECS | |
|---|---|
| Model | CLD-01 |
| Type | Temperature only with Dual Sensors |
| Temperature Range | Internal sensor: -23°C to +60°C External sensor: -40°C to +80°C |
| Humidity Range | N/A |
| Battery Type | CR2450 |
| Battery Life | Replace every 12 months |
| Accuracy |
Internal Sensor: ±0.3℃ (0℃ to +60℃) ±0.3℃ to ±0.7℃ (other temperatures) External Probe: ±0.5℃ (-20℃ to +40℃) ±1℃ (other temperatures) |
| Offline Memory | approx 24 days logging at 5 minute intervals |
| QUICK SPECS | |
|---|---|
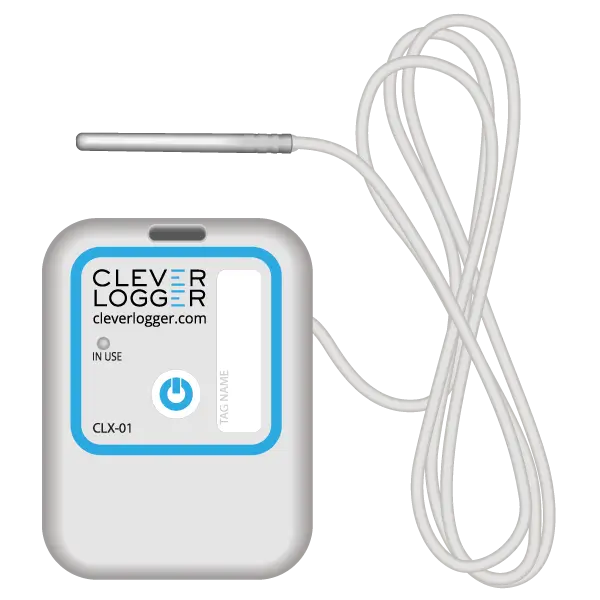
| Model | CLX-01 |
| Type | Temperature only with Probe |
| Temperature Range | -40°C to 60°C Can operate up to 80°C for short periods |
| Humidity Range | N/A |
| Battery Type | CR2450 |
| Battery Life | Replace every 12 months |
| Accuracy | ±0.5℃ (-20℃ to +40℃) ±1℃ (other temperatures) |
| Offline Memory | approx 24 days logging at 5 minute intervals |
To prove it, we’ll send you a Starter Kit to try out for a whole month.
Set it up, have a play, explore the features – obligation free.
If you love it, just let us know.
If not, just send it back.