FAQ
This graph close-up show how fridges work. The temperature in the fridge cabinet slowly rises as warmth from the outside raises the temperature of the air in the fridge.
When it reaches a certain temperature, a sensor turns the fridge’s compressor on and the temperature in the fridge starts to fall.
When the low temperature is reached, the compressor switches off. The temperature begins to rise and the cycle repeats.
This is something we see a lot in food fridges and freezers, but not generally in vaccine fridges – a defrost cycle. The regular spikes in temperature are the fridge warming up to prevent icing up.
In many vaccine fridges, the min/max temperatures are not updated during the defrost cycle. The fridge knows it is warming up, and so simply ignores it until the defrost cycle is completed. The logger is showing you what is actually happening in the fridge. See “what latency looks like” below for tips on reducing the recorded defrost cycle. If this doesn’t work and you have a vaccine fridge then you will need the technician to adjust the defrost settings.
This poor fridge is really struggling – it is low on refrigerant gas. When the compressor kicks in, the lack of refrigerant means the fridge can’t produce very cold air and must run for a really long time to lower the temperature.
This compressor is running flat-out constantly for hours and hours at a time. Imagine the electricity bill!
Here’s the opposite problem – a fridge that cooled things down too well.
In this fridge, the sensor that was meant to switch the compressor off at a certain temperature failed and the fridge kept running until the temperature reached a staggering -16°. Of course, everything in the fridge was frozen solid.
Different devices have different latency – that is, the time it takes to recognise a temperature change. Sometimes this is a bad thing. Sometimes, it is by design.
The graph below shows data from a Dual Temperature Logger.
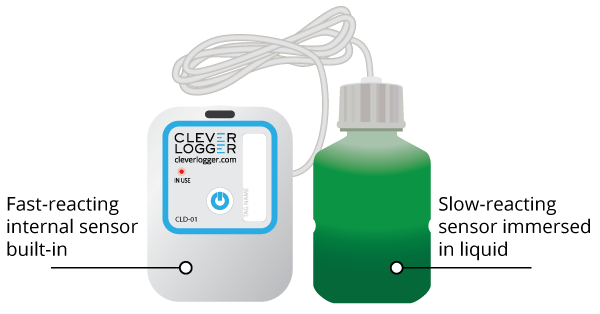
As the name suggests, The Dual Logger has two sensors – and internal sensor inside the case of the logger, and an external sensor inside a probe on the end of a cable.

In this example, the probe is immersed in a vial of glycol, so it has a much higher latency than the internal sensor.
This is reflected in the graph. The blue graph shows the sensor measuring the air temperature. The pink line shows the data coming from the probe in the liquid.
As you can see, the data from the liquid (in pink) shows much less variation between the upper and lower temperatures.
The graph below shows the difference in probe readings before and after placing the probe in the vial of glycol.
On the left, you can see the recorded temperature regularly dipped below the alarm line as the fast-reacting probe measured the cold air being blasted out by the fridge. (Remember that Strive for Five requires you to report every time your logger goes below 2°C.)
Then we see a spike where the probe was outside the fridge being placed in the vial.
And finally, we see the effect of the liquid. The graph is regulated and longer showing the huge fluctuations.
The two graphs are showing exactly the same fridge. They are both “correct” but one is closer to showing you air temperature and the other is closer to showing you the product temperature.
There is no such thing as “the product temperature”. The product’s temperature will be based on the size of the product and what it is made of. The product will also have a differing temperature throughout (the external part will change temperature faster than the middle). All we can do is mimic it the best we can.
If the logger is showing a wide temperature variation then there are some things you can legitimately do to slow it down so that it reacts more like the product:
These are also possible, but you need to confirm you aren’t avoiding the issue:
The whole point of having great data from your Clever Logger is to keep your fridge or freezer running perfectly and keep your stock safe.
This food fridge seems to be working OK, but the temperature is regularly above 5°C for long periods of time. The fridge needs to be adjusted so that the maximum temperature stays under 5° and out of the danger zone.
Tip: when manually adjusting fridge or freezer temperatures, make a small adjustment and check back in an hour or two to see what effect it has had, rather than one big adjustment.
When your Clever Logger starts letting you know about problems, it’s important to act.
In our last example, we see a fridge that was going along beautifully but then began to fail.
When you see anything out of the ordinary, contact your fridge technician immediately and get them to come and take a look.
Clever Logger is sold to government departments, public and private hospitals, and other large corporations. We understand that it’s often not possible to purchase with a credit card on a web site.
Call us on 1300 80 88 89 or send an email to [email protected] and we’ll send you a written quote. We are happy to send out most orders on receipt of a verified purchase order.


All prices are in Australian dollars and include GST

KEEP BATTERIES OUT OF REACH OF CHILDREN
Clever Logger loggers are intended for commercial use only. They contain small batteries. Swallowing can lead to chemical burns, perforation of soft tissue, and death. Severe burns can occur within 2 hours of ingestion. Seek medical attention immediately.
To prove it, we’ll send you a Starter Kit to try out for a whole month.
Set it up, have a play, explore the features – obligation free.
If you love it, just let us know.
If not, just send it back.

The National Association of Testing Authorities (NATA) is the recognised national accreditation authority for analytical laboratories and testing service providers in Australia. It is an independent, not-for-profit organisation that provides independent assurance of technical competence.
NATA accredits organisations to perform testing and inspection activities for their products and services. This gives consumers the assurance they need to make safe, healthy and reliable choices .

| QUICK SPECS | |
|---|---|
| Model | CLD-01 |
| Type | Temperature only with Dual Sensors |
| Temperature Range | Internal sensor: -23°C to +60°C External sensor: -40°C to +80°C |
| Humidity Range | N/A |
| Battery Type | CR2450 |
| Battery Life | Replace every 12 months |
| Accuracy |
Internal Sensor: ±0.3℃ (0℃ to +60℃) ±0.3℃ to ±0.7℃ (other temperatures) External Probe: ±0.5℃ (-20℃ to +40℃) ±1℃ (other temperatures) |
| Offline Memory | approx 24 days logging at 5 minute intervals |

| QUICK SPECS | |
|---|---|
| Model | CLX-01 |
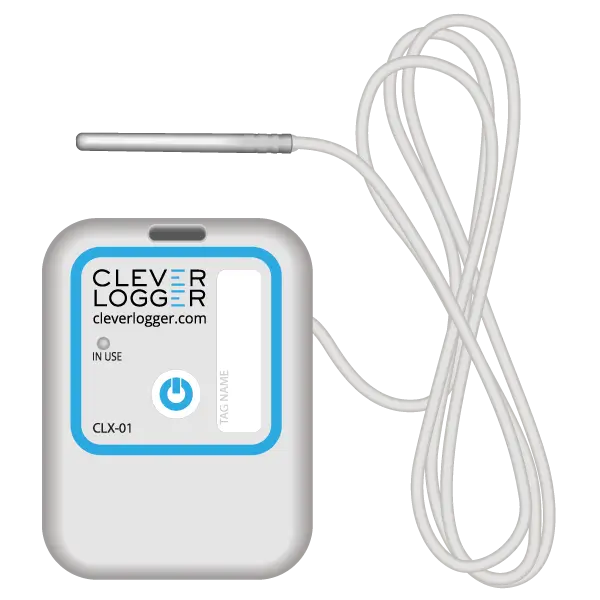
| Type | Temperature only with Probe |
| Temperature Range | -40°C to 60°C Can operate up to 80°C for short periods |
| Humidity Range | N/A |
| Battery Type | CR2450 |
| Battery Life | Replace every 12 months |
| Accuracy | ±0.5℃ (-20℃ to +40℃) ±1℃ (other temperatures) |
| Offline Memory | approx 24 days logging at 5 minute intervals |