Easy to use temperature data logger - logo

CLEVER LOGGER RELEASE NOTES

May 2023 Release – Location, location, location

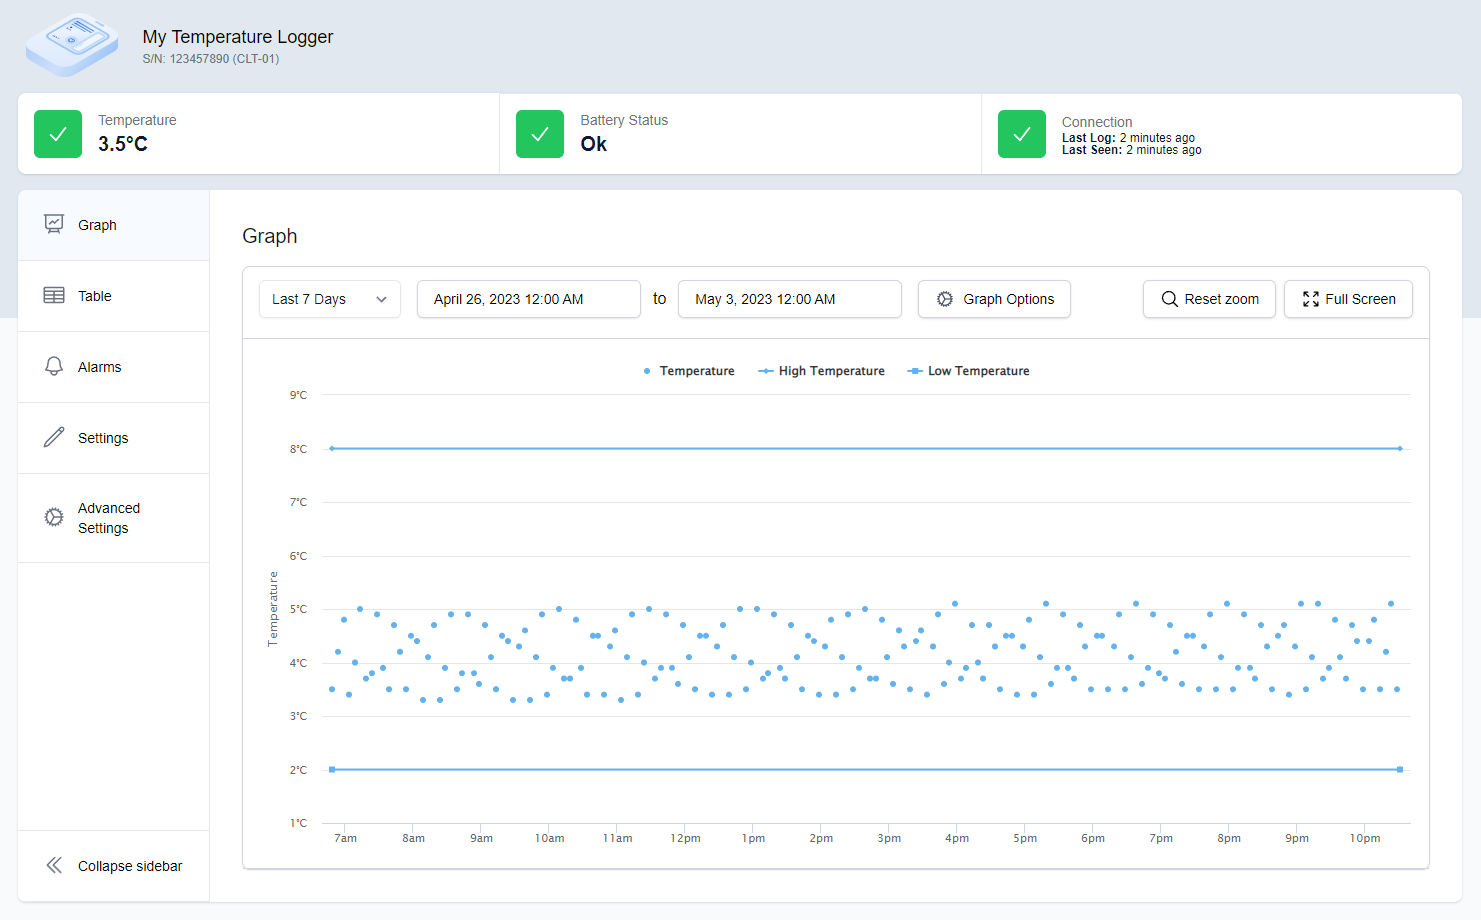
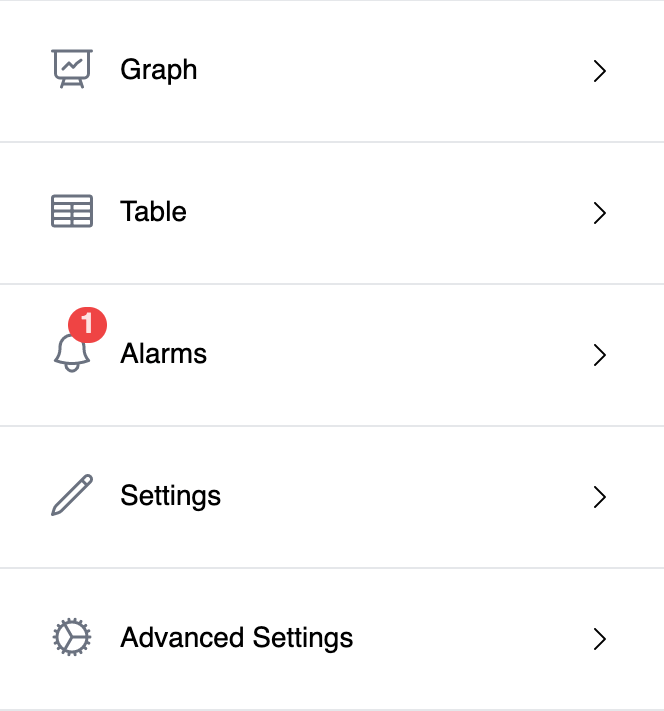
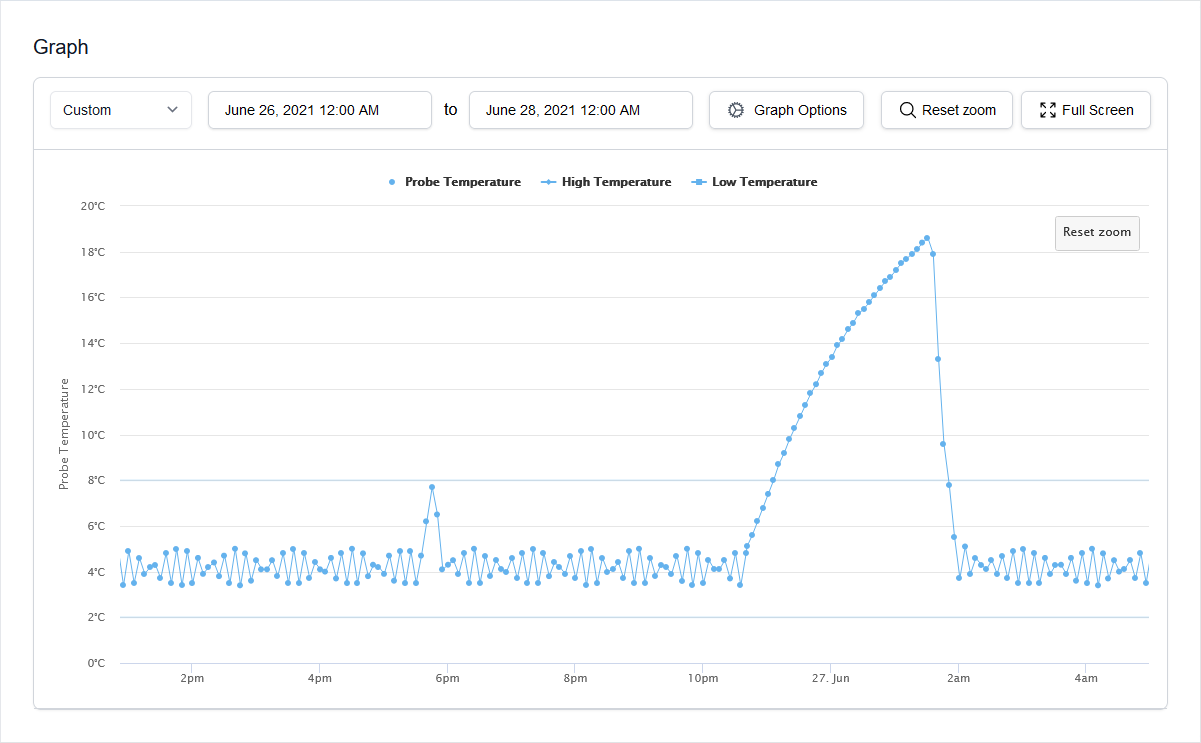
In our latest release of Clever Logger we have given the location screen a total overhaul. This is to make it even easier to see information, as well as a chance to make it prettier. For many users it will also show you some awesome features that have always been there, but you didn't know.

Location - it's hard being easy

The developers have been very busy over the last couple of months giving the location screen a total overhaul. Our goal is to make Clever Logger the easiest to use temperature logging system available, as well as offering a powerful range of options for advanced users. We are totally stoked with this month’s release and hope you will be too.

We are covering new and existing functionality because this is a great opportunity to work out how to get the most out of the location screen.

Side menu

The Locations menu

The new side menu on the location screen now makes it easier to jump into the critical information that you need to see. 

It is now more obvious that there is a table view, and users can quickly view the settings (if they have the right role).

This post covers each of the screens in a bit more detail.

Graph

graph showing temperatures during power failure
A graph showing a temperature breach after a power failure

The graph is still the default view because it gives you an immediate visual overview of what has happened in the past week.

The “graph options” allows you to also select what is on the graph including:

  • temperature
  • humidity
  • signal strength

There is a new “full screen” mode, which makes the graph much easier to view in the Clever Logger app, and makes the most of a 50″ monitor.

Zoom

zoom on graph

The zoom feature allows you to instantly zoom in on something already in the graph. This is much faster than changing the date and time range.

To zoom in:

  • Move the mouse to the start of what you want to zoom in on,
  • Hold down the left mouse button,
  • Drag it to the end of the period you want to zoom in on,
  • Release the mouse button

To zoom back out, click the “reset zoom” button.


Graph controls

1. Presets

Choose from a range of common date ranges.

2. Custom date and time range

You can change the date range by entering a start and end date and time.

This is a great way to restrict the graph display to a specific incident.

3. Options

Some fine control options including displaying the signal strength of the connection between the logger and the gateway.

Table controls

1. All Readings

The table screen initially provides a detailed list of all recordings.

Like the graph, you can change the date/time range to narrow in on a specific event.

The “rows per page” is a handy feature if you want to display a large number of recordings in one go.

2. Min-max views including half-day

The table can quickly be summarised into either a daily min/max or a twice daily min/max.

The twice daily min/max was a request by people monitoring vaccine fridges, and it’s what some auditors expect to see.

3. Export to CSV (Excel)

The “Export to CSV” option will save the data to your local computer as a “.csv” file.

You can then open this file in other applications like Excel.

Alarms

The alarms screen shows a list of all current alarms. You can also view historical alarms, and see any comments attached to them.

managing alarms

Clever Logger alarms explained

Overview of alarms including what they are and what to do when an alarm occurs.

Settings

This is a big change that got the support team excited. Instead of having to click “next” through half a dozen screens to see a specific setting, you can see a summary and then jump straight to that setting.

The screen to edit each alarm has also been improved, with easier options and a more friendly design.

logger settings

Clever Logger location settings explained

What are the location settings and what should they be? How do you set up alarms to avoid false alarms and determine who should be notified? Click “Open” to find out more.

Advanced Settings

This section contains infrequently used options.

  • Battery status is useful to know when your battery will need replacement.
  • Change site is used to easily move a location from one site or organisation to another (e.g. if you’re moving a fridge from one department to another).
  • Archive location is for when you no longer need to monitor something (e.g. you disposed of a vaccine fridge). The historical recordings will still be available, but it won’t appear by default.
  • Device details lets you see the signal strength between this location and different gateways, and to swap the device that is linked to the location.

Got suggestions?

We are always looking to improve the Clever Logger experience for our users.

If you have a suggestion for a feature you’d like to see, we’d love to hear about it.

Please use the form below to tell us about your idea.

30-DAY FREE TRIAL

You're going to love Clever Logger

To prove it, we’ll send you a Starter Kit to try out for a whole month.

Set it up, have a play, explore the features – obligation free.

If you love it, just let us know.

If not, just send it back.

What is NATA?

The National Association of Testing Authorities (NATA) is the recognised national accreditation authority for analytical laboratories and testing service providers in Australia. It is an independent, not-for-profit organisation that provides independent assurance of technical competence. 

NATA accredits organisations to perform testing and inspection activities for their products and services. This gives consumers the assurance they need to make safe, healthy and reliable choices .

Location Views

In the top right corner of the Location page, you will find the View chooser.

There are three options: Simple, Detailed and Gauge.

change-location-view

Other "How To" articles

Frequently Asked Questions