June 2021 Release – Dual graphs, twice daily min/max
The first June 2021 Clever Logger release is the start of a number of changes in how we display the data. In this release we have the dual temperature capability (great for temperature + humidity) as well as the twice daily min/max.
The video version
“In this straight to video adaptation of the release notes, we see Shane take the script and really start to delve into the deeper issues. There was no budget spared on the special effects, and the ending will leave you in tears.”
Or not. Enjoy!
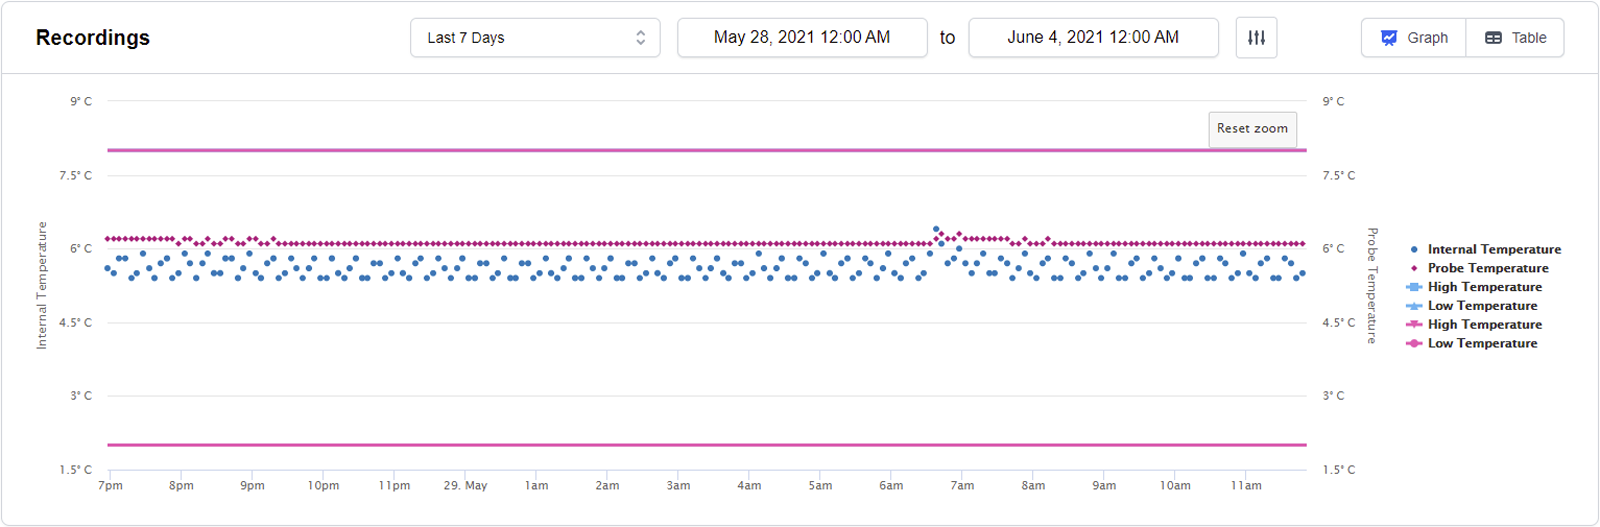
Multiple Graphs
Useful for
Displaying temperature and humidity
Dual channel loggers with the internal and external probe
Key features
Hover over a line to highlight it (useful for when they overlap)
The scale on the left is for the first series (typically the temperature) and the right scale is for the second series (typically the humidity or the external probe)
Turn lines on or off by clicking on the item in the legend (on the right hand side)
Change which sets are displayed with the “Settings” button
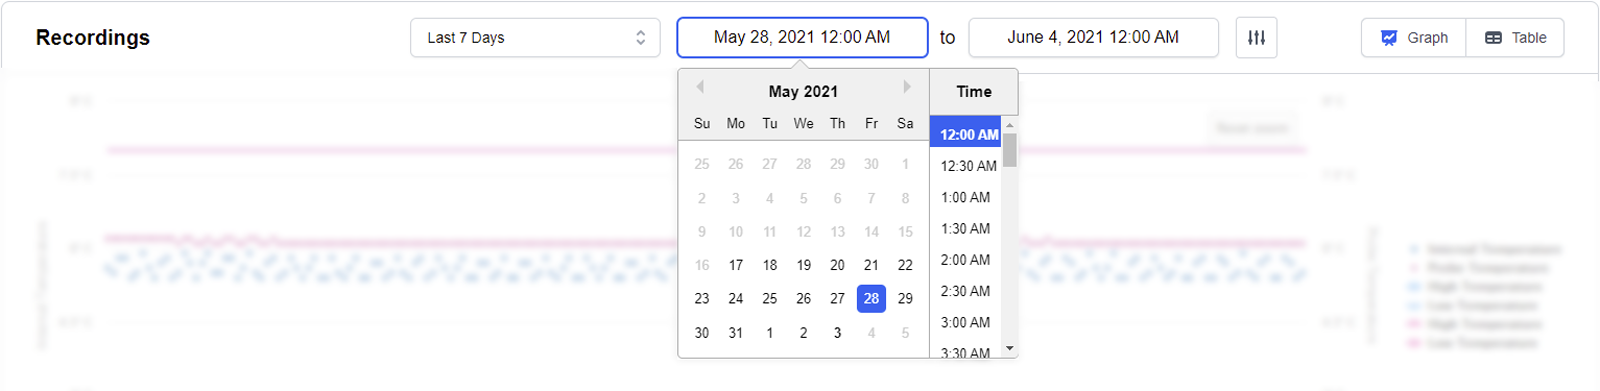
Date and time picker for showing data
Useful for
Graphing a much narrower time range of temperatures
Show the data only for a specific breach and the period before and after it
Key features
Both the start and date can be specified with a date and time
Time can be specified down to the half hour
Keep in mind that the zoom feature is still a great way of seeing a specific time range in the graph
The date filters also filter the results in the table view
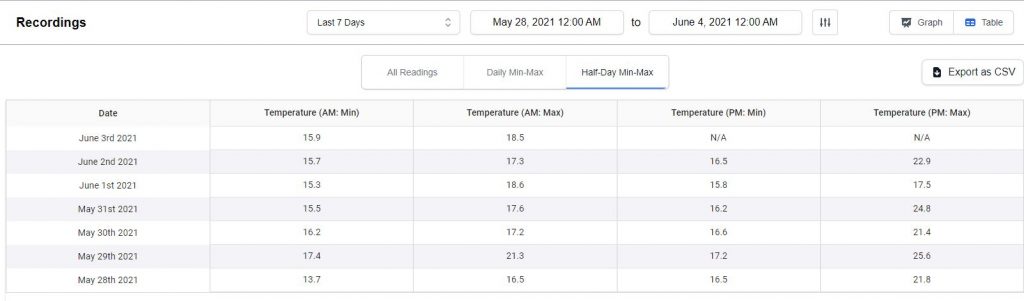
Twice daily min/max
Useful for
Pharmacies and GPs who are caught up on the twice daily min/max reading for vaccine fridges
Useless for
Note that the intent of Strive For Five is to minimise the gap between a temperature breach and you being aware of it. Clever Logger will automatically notify you the moment there is a problem.
Some auditors are still expecting you to manually record the minimum and maximum twice a day. Doing it retrospectively is questionable, but then doing it in the first place is questionable.
Key features
The AM and PM minimum and maximum for each day are shown on the same line (they used to be split across two lines)
Use the “Export as CSV” to save it to a file and open it in another application
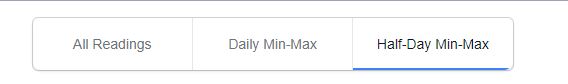
To use it
Click on the “Table” icon in the top right corner
Click on the “Half Day Min/Max” button above the table
Specifics
The day is literally broken into AM and PM. There is no concept of opening hours and this will not attempt to store the value at the start and end of your trading day.
The order is AM minimum, AM maximum, PM minimum, PM maximum.
For multiple channel loggers, it shows the first channel’s data (as above) and then another 4 columns with the second channels loggers.
Keep in mind...
Clever Logger can automatically email you a minimum/maximum report twice a day, once a day, once a week, or once a month.
The “minimum/maximum plus extremes” is a better report to have emailed to you. It also tells you what the problems were, if any.
Got suggestions?
We are always looking to improve the Clever Logger experience for our users.
If you have a suggestion for a feature you’d like to see, we’d love to hear about it.
Please use the form below to tell us about your idea.
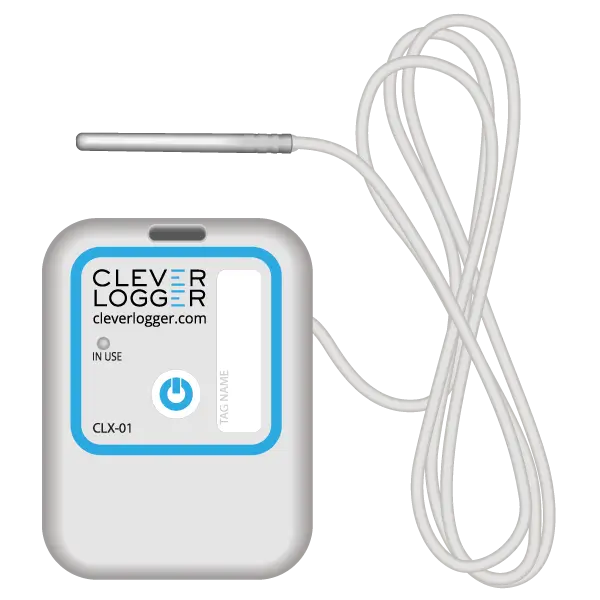
30-DAY FREE TRIAL
You're going to love Clever Logger
To prove it, we’ll send you a Starter Kit to try out for a whole month.
Set it up, have a play, explore the features – obligation free.